My post last Monday about March weather pointed out that there's often an early to mid March warm up here in Ithaca and Freeville before winter heaves one last sigh. This has happened over the past few days. On Sunday we warmed up into the 50s for the first time since January 31. It stayed warm through Monday and most of Monday night, but not quite as warm as expected because it was cloudier than expected. The winds picked up Monday night, and by early Tuesday morning (today), it had cooled down into the lower 40s and upper 30s. We picked up about a half-inch of rain (0.44" at my house), and that rain combined with the melting of what snow was left with the warmer temperatures has swollen the creeks in the area and ponded water on low-lying ground.
And now we're faced with, to quote The Simpsons, "lousy Smarch weather". It's going to be relatively cold - in the 30s - with a chance of snow showers through the rest of the week. It figures: I just washed my car. But I'm hoping that by the middle of next week we'll be back into a warming pattern, and warmer weather will be here to stay.
Showing posts with label rain. Show all posts
Showing posts with label rain. Show all posts
Tuesday, March 12, 2013

Wednesday, February 27, 2013
Ithacation

We had a mess of a storm come through late yesterday afternoon through earlier this afternoon, bringing pretty much every type of winter precipitation with it. At times, it was simultaneously snowing, sleeting, and raining. We have a word for this here in the Ithaca area - ithacation. It's ithacating when you don't exactly know what's falling from the sky, but you know you don't like it.

In these two photos, I hope you can make out both the large snowflakes that were falling and the small ripples on the surface of Fall Creek due to rain and water drops dripping off of the branches.

Some branches were covered by only water drops, while others had snow on them as well. Welcome to late winter snowstorms in Freeville.


Friday, February 1, 2013
Wild Weather Day

We experienced a sudden warm-up here in central New York earlier this week. Temperatures were warmest late on Wednesday afternoon, topping out at nearly 60 degrees. It stayed warm through the evening and well into Wednesday night, until the arrival of the cold front sent temperatures plummeting between and 3:00 and 4:00 am. At the Ithaca airport, a few miles from my house, the mercury dropped from 53 to 43 in an hour (or less), and the drop was even more dramatic at Cornell's weather station, from 53 to 40 within the same hour.

The rain moved in around 8 pm last night, and a light to moderate rain lasted all night and into the morning. In all, there was 1.35"of rain (and one pine needle) in my rain gauge in the backyard when I checked it this morning. That's quite a bit more than at the Ithaca airport. I had made the mistake of not checking it yesterday afternoon before the rains started and I had been out of town for a few days, so it's possible that last night's rain was less than that.


The creek was higher than I've seen it so far. The dock was submerged by, I'd guess, nearly a foot of water. The bottom step was submerged by a few inches of water. The creek was swollen. Downstream, in an area where the bank is virtually flat, right near the confluence of Virgil Creek and Fall Creek, the water had spilled out of the banks and onto the surrounding grass. The roads and buildings were far enough away as to be unaffected.


In any event, sometime after 7 am, the rain transitioned to a brief period of granular snow or graupel (see first photo of the post). There was a light coating on the ground. We had some flurries over the course of the day, but the winds (and perhaps more accurately stated, the wind shear) seemed to be too strong for sustained lake effect snow.

The winds picked up early Wednesday in advance of the cold front, but the strongest winds arrived today in its wake. Around 1:00 this afternoon, the Cornell station recorded a maximum gust of nearly 40 mph, and sustained winds were steady at about 20 mph for most of the afternoon. I stood outside for about 10 minutes late this afternoon, and that was more than long enough. With a temperature around 30 and winds of 20 mph, the wind chill was about 17. It felt pretty bone-chillingly cold, though...much like it did last week when temperatures hovered in the teens.


Saturday, December 8, 2012
Odds and Ends

After my initial excitement over having a rain gauge to measure the rainfall from what was left of Hurricane Sandy, I gradually forgot about the rain gauge completely in the past couple of weeks until last night. We've had a few days of unsettled, rainy weather as a series of disturbances has passed through, and we'll see even more rain tomorrow and especially tomorrow night. I went out to check the gauge today, and it had collected 1.15" of rain over the last couple of weeks, most of which fell this past week, and particularly in the past few days. The creek has again risen to near the base of the dock, but this seems to be something the dock can withstand with no problem, so I felt completely safe scrambling down onto the dock today.
It was again nice and mild today despite abundant cloud cover and occasional showers, topping out at about 49 degrees at both the Ithaca airport and the Cornell weather station. The relatively nice weather encourages me to get outside and collect stuff for the blog, and I never know exactly what I'll find in the yard or think to write about while I'm out there. By the way, I hope to get a nice weather station of my own to install in the garden at some point...knowing me, it will ideally having a logging function so I don't have to stay of top of it every day.
I'm also in the process of installing Christmas lights in the front windows. I'd hoped to get it all done today, but I have to pick up some rubbing alcohol during my grocery store run this weekend to properly clean the windowsill before sticking adhesive to it, so I'll get to the other window tonight or tomorrow. I'll try to post a picture tomorrow night.
One thing that has struck me since moving here and doing the blog is that I tend to notice some of the simple beauty of nature more often. This evening, this was evident in the subtle gradient in sky color
from light gray in the foreground to a darker gray nearer the horizon. This time of year, the sun tends to set towards the left of the picture, so if anything, I would expect the horizon to perhaps be a bit brighter. But it could be an optical effect of the distance of the clouds, or it could be that the clouds in that direction were a bit thicker, letting less light through. I think this is the first picture that I've posted to the blog showing most of the backyard. It looks from out of my living room window in the back of the house toward the creek. The garden sits to the left of the picture in the foreground...you can see some of the garden fringe's dirt on the lower left.

Friday, November 2, 2012
A Week of Sandy: A Wrap--up
Chilly, cloudy, soggy, dreary. That's a pretty apt summary of the week here in Central New York. Sure, we had some steady rain and wind on Monday and Monday night, but overall the weather has just been...blah. We didn't get anywhere near the amount of rain from Sandy that I thought was possible, and this was a good thing. We had plenty of rain last week and some more over the weekend, so a few more inches on top of that would not have been good. But the heaviest rain was on the western side of Sandy, and Sandy tracked to our west. Then Sandy tracked to the north, and to then the northeast. Her associated upper-level low pressure center, though - the fingerprint of the storm higher in the atmosphere - remained stuck over us. As a result, we've had a series of chilly, cloudy, showery days since Sandy departed. It's been the Week of Sandy here in Freeville.
This week has been my first chance to compare my rain gauge measurements with my crude observations of the creek's rise and fall. Before, I was relying on rainfall measurements from the Ithaca airport, several miles away. While my rain gauge isn't representative of the whole basin contributing to the runoff into the creek, its should be more indicative than the airport measurements were. This post is a quick look at what I found this week.
 Monday afternoon. We only received 0.05" of rain Sunday into Monday morning, and the heavier rains didn't approach the area until later Monday afternoon and through the evening hours. Before Sandy's infuence arrived, though, the creek was already higher than normal, and only a few inches below the dock.
 Tuesday morning. I measured 0.35" of rain, but I wonder if more fell in upstream areas, because Fall Creek had swollen to within an inch or two of the base of the dock. The stream was moving quickly, but I didn't fear for the dock's safety. The water was calmer near the dock than in the middle of the stream. The heaviest rain had fallen and the dock was in good shape.
 Tuesday late afternoon/early evening. More rain fell during the day, other rain that had fallen had time to accumulate in the creek, and by dinnertime the water was up to the base of the dock. Still, though, the dock was holding strong and the rate of rise was low, so I wasn't concerned.
 Halloween morning. I measured 0.24" of rain that had fallen between Tuesday morning and Wednesday morning. The water was still up to the base of the dock - holding steady but not threatening to rise much higher.
 Thursday morning. Though it was still raining - as you can see by the ripples on the water - the water level of the creek was going down as the water coming into the watershed from rainfall wasn't keeping up with the water leaving the watershed along the creek. I measured a total of 0.20" of rain from Wednesday morning to Thursday morning.
 Friday morning. The creek is, if anything, higher than Thursday morning. The water level is still within 2-3 inches of the base of the dock. We're expected to finally see a break in the shower activity starting on Sunday, and so the creek should start going down over the next few days. I recorded 0.15" of rainfall from Thursday morning to Friday morning. The small waves that you can see on the creek's surface are from a quartet of mallards that I scared off upon my approach to the creek.
Here's a series of photos looking at the progression of the swollen creek over the course of the week:
 A look upstream on Monday afternoon. Though we hadn't gotten much rain yet, the creek was already swollen.
 Tuesday morning.
 Tuesday late afternoon/early evening
 Halloween
 Thursday morning
 Friday morning
And finally, here's a map from our local Weather Service office with rainfall estimates of precipitation from radar. As you can probably tell, radar can't come close to the accuracy of rain gauge measurements, though it is slowly improving. The heaviest rains fell in the Eastern Shore of Maryland, with much of Maryland, Delaware, and southern New Jersey receiving an estimated 5"+. It's pretty easy to follow the track of Sandy across central Pennsylvania and western New York - just follow the higher precipitation totals (except for the Cleveland area). The small black dot toward the upper center of the map shows the approximate location of Freeville.

This week has been my first chance to compare my rain gauge measurements with my crude observations of the creek's rise and fall. Before, I was relying on rainfall measurements from the Ithaca airport, several miles away. While my rain gauge isn't representative of the whole basin contributing to the runoff into the creek, its should be more indicative than the airport measurements were. This post is a quick look at what I found this week.



Here's a series of photos looking at the progression of the swollen creek over the course of the week:
 A look upstream on Monday afternoon. Though we hadn't gotten much rain yet, the creek was already swollen.


And finally, here's a map from our local Weather Service office with rainfall estimates of precipitation from radar. As you can probably tell, radar can't come close to the accuracy of rain gauge measurements, though it is slowly improving. The heaviest rains fell in the Eastern Shore of Maryland, with much of Maryland, Delaware, and southern New Jersey receiving an estimated 5"+. It's pretty easy to follow the track of Sandy across central Pennsylvania and western New York - just follow the higher precipitation totals (except for the Cleveland area). The small black dot toward the upper center of the map shows the approximate location of Freeville.

Tuesday, October 30, 2012
...and the dock was still there
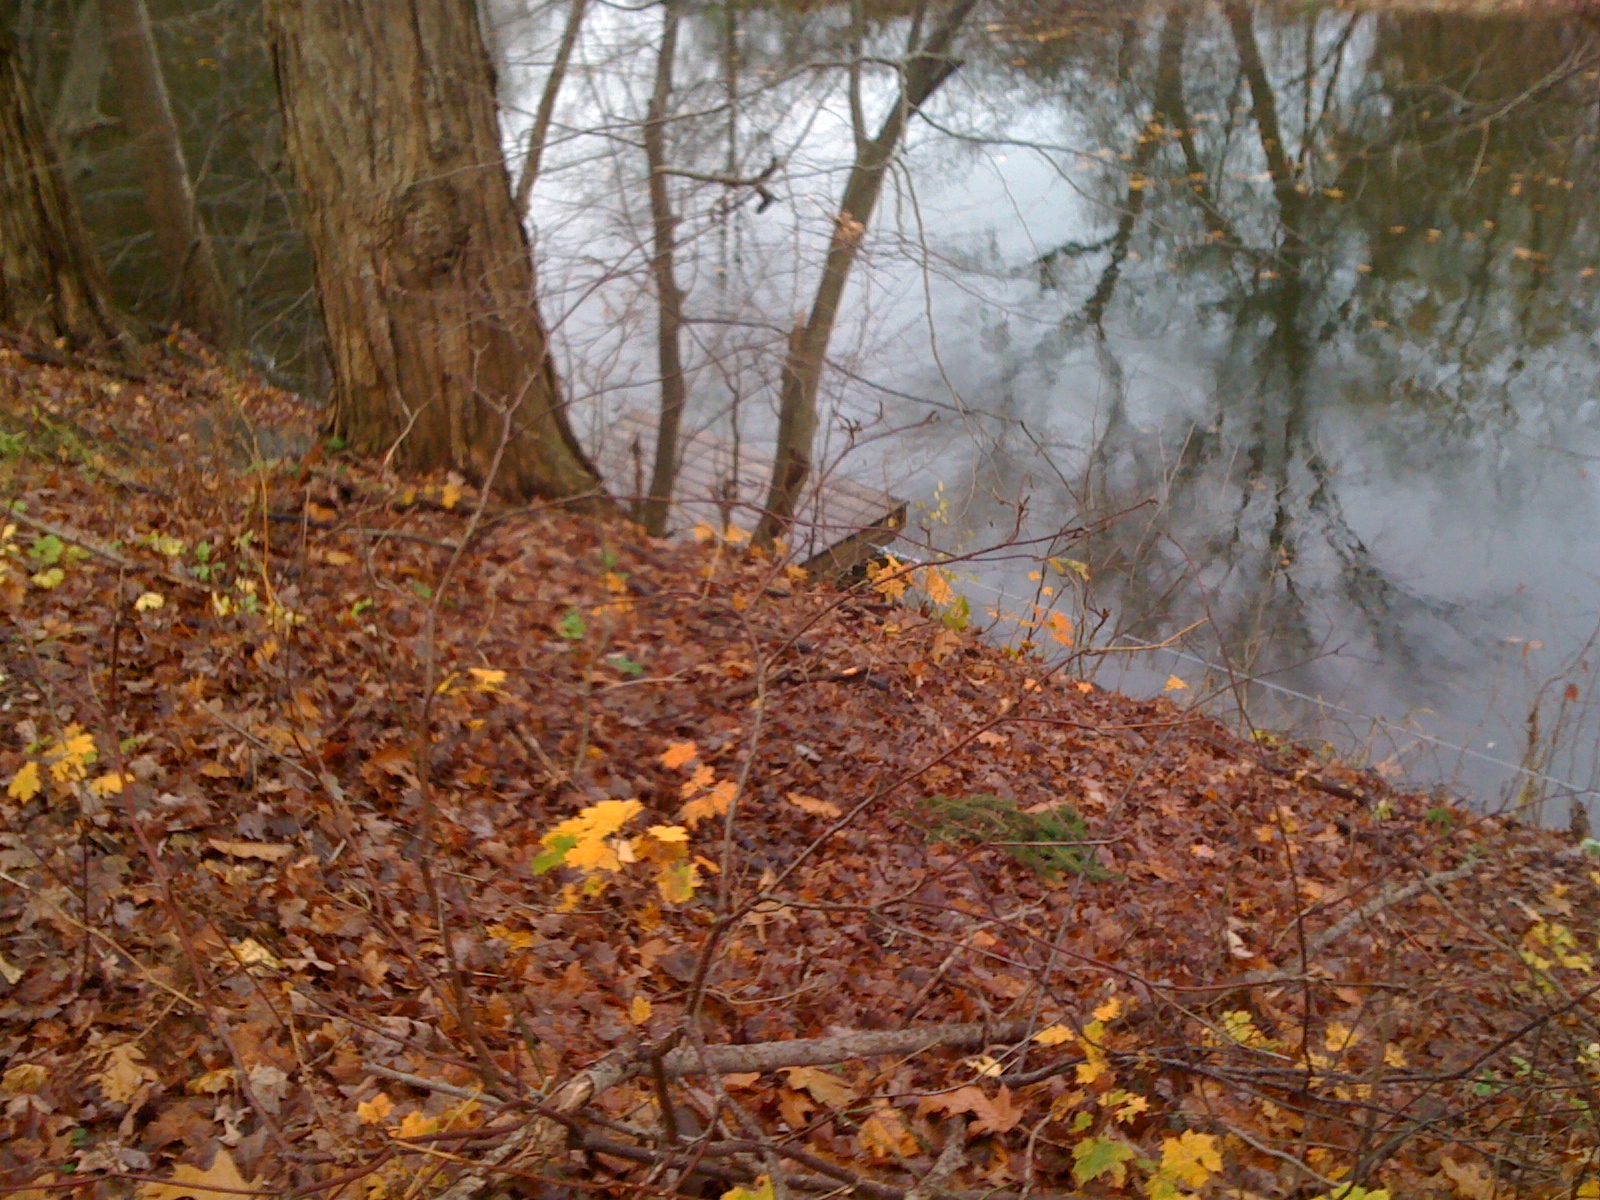
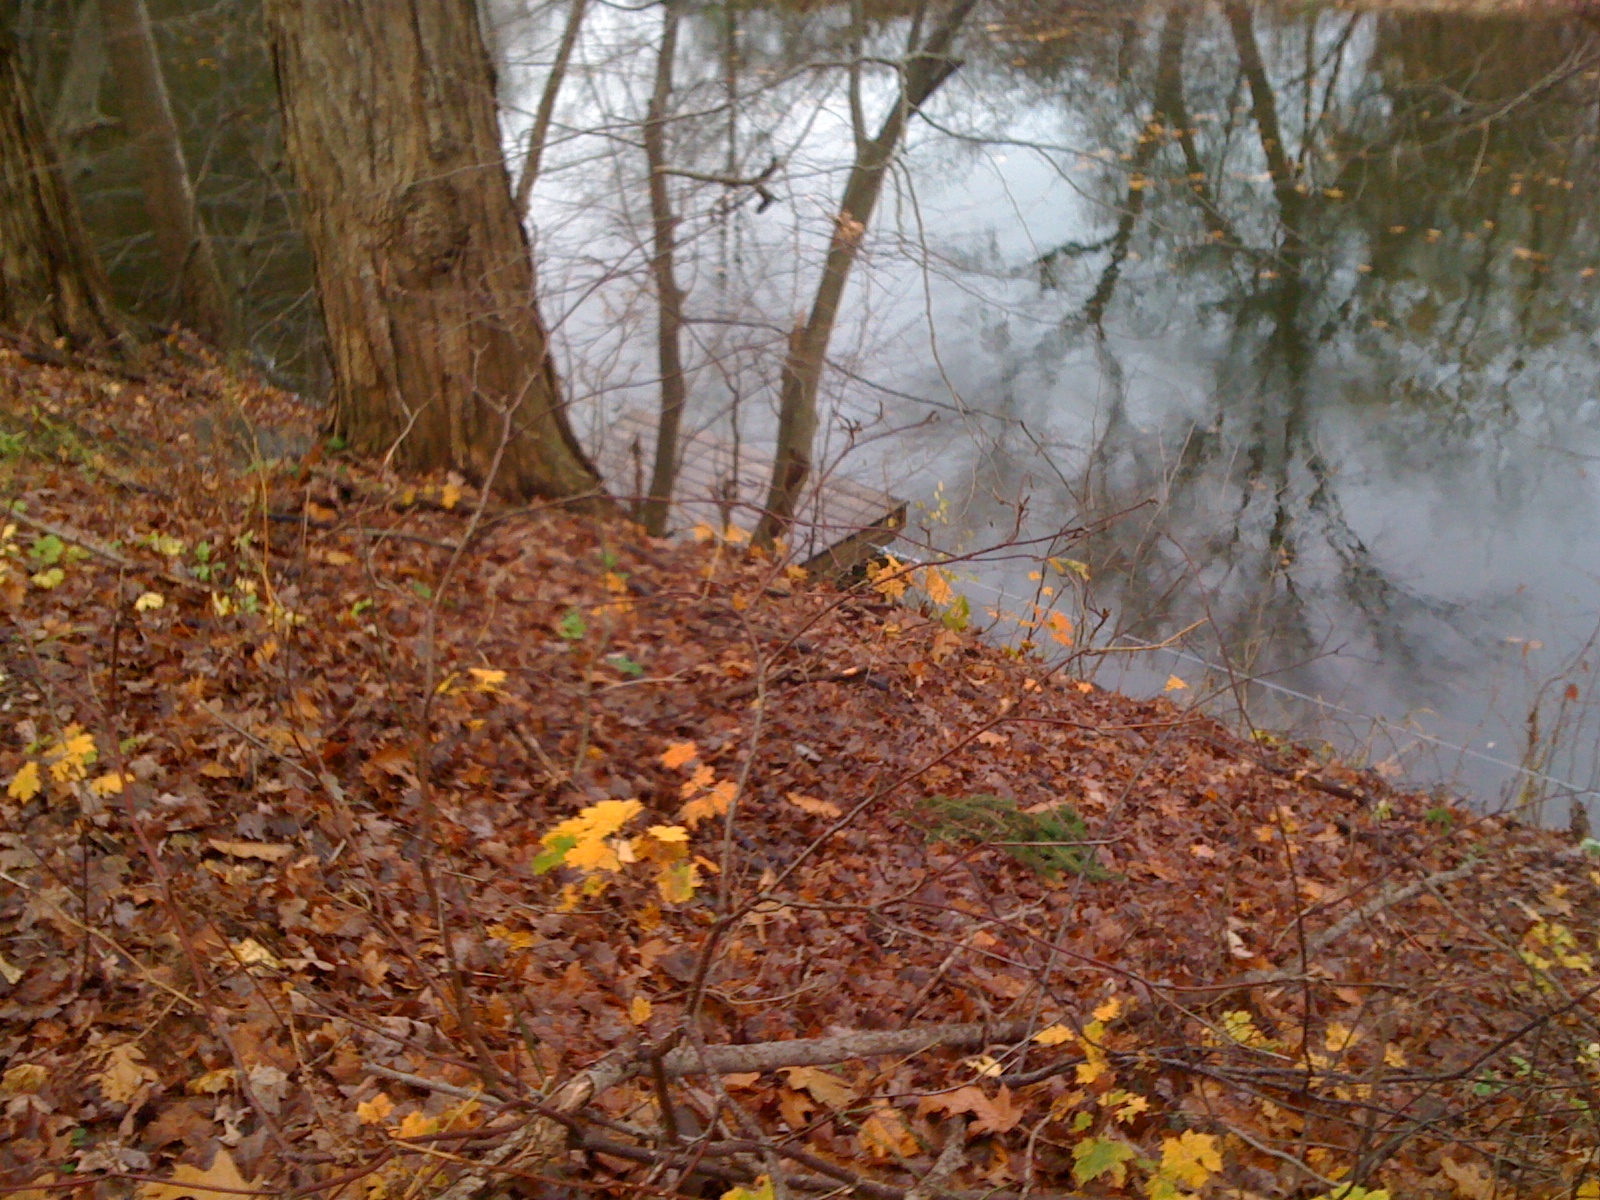
Well, the worst of what had been Hurricane Sandy has come and gone, and the effects here in Freeville were remarkably light. My new rain gauge measured a grand total of 0.35" of rainfall yesterday and overnight. The creek has risen a bit, but the water level is still a few inches below the base of the dock, as you can see below.

The creek has risen a couple of inches since yesterday morning, as you can see from the pair of photos below. Probably the best means of comparison is the small tuft of green towards the left that sits a couple of inches above water level in the top picture but right at water level in the bottom picture. We're expecting to get some more rain today, but I don't think it will be enough to threaten the dock.


We had some wind with the storm, particularly last night. It was consistently breezy, with some stronger gusts...but nothing like what folks experienced in the New York and Philadelphia metro areas. The flag at the post office was flapping pretty steadily, and I could occasionally hear the gusts blowing against the house. Overall, though, the number and size of branches down was considerably less than during some of the stronger thunderstorms we've experienced since I moved here. We're supposed to have a little more wind throughout the day today, but like the rainfall, I don't expect any significant problems from it. I was fortunate to get through the storm unscathed, and I hope, if you were in the path of the storm, you managed to avoid major problems, too. Here's a look at the downed branches/twigs that I found around the yard (yup, that's it!):


Monday, October 29, 2012
Preparing for Sandy

First of all, I did get a little bit of work done between (and during) the rain showers this weekend. Nothing exciting, though. I did some raking in the backyard, and with the help of my parents, who were in town for the weekend, I got the leaves bagged from the front yard. I also bagged much of the brush that I had cleaned up and piled in the garden (you can see some of it in the background of the picture above). Finally, I now have a rain gauge installed in the garden, as you can see above. Now I can monitor the rainfall much more closely over the next couple of days. One other note - I was standing out by the dock on Saturday, when my backyard was subject to a bird invasion from the other side of the creek. All of a sudden, cardinals, chickadees, tufted titmouse, and two red headed woodpeckers crossed over into my yard and made a dash for seeds and trees. It was nice to see some bird action, finally. Maybe the yard isn't in such bad shape after all!
Be warned that this blog will be in Sandy mode for the next 2-3 days. I'll be reporting on excitements such as whether my dock survives and just how many branches come down in the front and back yards. I've made my own preparations for Sandy, of course. The biggest concern is that the winds will knock trees onto power lines, causing an outage. For such an eventuality, I've stocked up on water for cleaning and toilet flushing. I have plenty of bottled water, soft drinks, and pink lemonade on hand. I'm planning to fill the freezer with plastic bags full of water (which will freeze) to keep things cold. I have a flashlight, a small battery-powered lamp, and candles. I'm also not parking my car under the tree in the front yard during the storm.
Right now, it's cloudy and relatively calm. There's just a bit of light drizzle and a steady, light breeze. At the Ithaca airport, 5.5 miles away, the wind is at 13 mph with gusts to 18. The steady to heavy rain is expected to move into the area starting around mid-afternoon. Winds will pick up as well. The worst of the storm will come tonight into early tomorrow morning - this is when I'm concerned about a potential power outage. Overnight, the National Weather Service is forecasting sustained winds of 28-33 mph (just under tropical storm force) with gusts to 47 mph. The storm will wind down tomorrow afternoon into tomorrow night. The current rainfall forecast is for a storm total of 1.23" in Ithaca and slightly less here. This bodes well for the dock, as it's already survived a similar amount of rainfall this fall. However, the creek is still running high from rains late last week and over the weekend, and I wouldn't rule out the possibility of getting significantly more rain than forecast (say, more than 2") if we find ourselves in the path of a heavy rain band or two.
I may check in with an update later tonight, and if not, I'll do my best to post an update tomorrow at noon, depending on my power situation at home and whether the Cornell campus remains open. If you're in the path of the storm, stay safe!
Sunday, October 28, 2012
Forecasting Sandy
I've been following the progress of Hurricane Sandy pretty closely. This is a rare scenario - a late-season hurricane, with high pressure over the Atlantic, and an arctic cold front pushing into the Eastern Seaboard. The result? A storm that will have tremendous impacts over a wide area. While there won't be the massive, wholesale destruction of a Category 4 or Category 5 hurricane, the effects will be spread much farther afield. Tropical storm force winds will likely affect the states of North Carolina, Virginia, Washington DC, Maryland, Delaware, New Jersey, Pennsylvania, New York, Connecticut, and Massachusetts, and in many places, those strong, sustained winds of at least 35 mph will persist for 12 to 24 hours. On top of that, several inches of rain will fall over a wide swath of territory, saturating trees' roots and making them more susceptible to topple in the winds. Power outages will be common and widespread, and it will likely take days to bring it back online everywhere. But much of this is common knowledge by now.
I want to give you a look at the process of forecasting an event like this. First, you have to know what's currently going on...forecasting starts with observations. In the US, forming the core of the observational network are the automated weather stations that are located at airports and other significant sites across the country. These stations measure temperature, dewpoint, winds, clouds, and precipitation, among other things, and they are reported every hour. There are other, usually local or regional, networks of automated weather stations as well. It's important to understand what's happening not just at the surface, but also through the depth of the atmosphere. Weather balloons are launched twice daily (morning and evening) from National Weather Service offices and other sites across the country. In preparation for Sandy this weekend, over 200 extra balloons were launched in the afternoon to gain additional data about the state of the atmosphere...a first! Of course, it's also important to have observations of precipitation, and for this there is a network of cooperative observers who report 24-hour rainfall every morning. Much like for surface observations, there are numerous local, regional, and national rain gauge networks to measure precipitation at time steps from every 5 minutes to every 24 hours.
In addition to the measurements that are taken in situ (directly in the environment), there are two major means of remote sensing used by meteorologists. Radar detects precipitation and estimates rainfall totals. The national radar network is currently undergoing an upgrade that will improve rainfall estimates, improve detection of precipitation type (snow, sleet, hail, graupel, rain, etc.), and have other benefits to forecasters and researchers. Radar can also estimate the direction of the wind field...this is what allows forecasters to find "Doppler-indicated" tornadoes. In addition to radar, satellites provide information about clouds, precipitation, moisture, and even surface temperature. For a storm like Sandy that has spent much of its life out to sea, satellite data is invaluable.
Once observations have been collected, they're fed into computer models that use the fundamental equations of the atmosphere to forecast future conditions. There are several models, and each model is run several times with small changes to the observations and with slightly different ways of estimating atmospheric processes to provide insight into the different ways that the atmosphere might evolve. The more similar the different model runs are, the more confident forecasters can be in what is likely to happen. Early in the process of forecasting Sandy, the models disagreed on where she would go. Most turned her westward and brought her onshore, but they disagreed as to where - anywhere from Virginia to Nova Scotia. A couple of models took her out to sea and kept her away from the US mainland. The following few figures show a series of predictions of the models' projected path for Sandy from late last week. You can see that as time went on, the models tended to agree on a US landfall, and they began to narrow the location down. Sorry for the blurry first figure!


Of course, forecasting is not left entirely up to the models. Human forecasters look at the model output and the current observations. Using their own knowledge of the models' tendencies, the trends from the current observations, and their knowledge of past storms, the forecasters make predictions about the most likely path for Sandy and the weather that she will bring. The National Hurricane Center is charged with forecasting hurricanes, and they produce graphics like the ones below. The dots indicate the most likely position of the storm's center, and the hatched area around it shows uncertainty in this path...the storm center is expected to stay within this cone. For a gigantic storm like Sandy, though, the storm's effects are felt well outside the cone. Take a look at the series of track forecasts below to see how the forecast has evolved over the last few days.


![[Image of 5-day forecast and coastal areas under a warning or a watch]](http://www.nhc.noaa.gov/storm_graphics/AT18/refresh/AL1812W5_NL+gif/120153W5_NL_sm.gif)
![[Image of 5-day forecast and coastal areas under a warning or a watch]](http://www.nhc.noaa.gov/storm_graphics/AT18/refresh/AL1812W5_NL+gif/153841W5_NL_sm.gif)
![[Image of 5-day forecast and coastal areas under a warning or a watch]](http://www.nhc.noaa.gov/storm_graphics/AT18/refresh/AL1812W5_NL+gif/211343W5_NL_sm.gif)
![[Image of 5-day forecast and coastal areas under a warning or a watch]](http://www.nhc.noaa.gov/storm_graphics/AT18/refresh/AL1812W5_NL+gif/085338W5_NL_sm.gif)
![[Image of 5-day forecast and coastal areas under a warning or a watch]](http://www.nhc.noaa.gov/storm_graphics/AT18/refresh/AL1812W5_NL+gif/205341W5_NL_sm.gif)
Of course, forecasting the path of the storm's center is only a small part of gauging the storm's
impact. The Hydrometeological Prediction Center makes forecasts of rainfall totals across the nation every day, and a storm like Sandy keeps the forecasters especially busy. Below is a series of maps showing HPC's long-term (5-day) forecasts for total rainfall. You can see how the rainfall forecast changed as predictions of Sandy's strength and path changed. Here in central New York, we're looking at 1-3" of rain over the next couple of days, though more than that is possible in local areas, especially on higher ground.

Here's tonight's rainfall forecast for the storm, issued by the local Weather Service office, located in Binghamton, NY. These offices are staffed 24/7, and they'll certainly have extra help around for the duration of the storm. The local offices are in charge of issuing watches and warnings (such as the Flood Watch and High Wind Watch that we're currently under) for their forecast areas. They also coordinate with local emergency managers, storm spotters, cooperative observers, broadcasters, and the public to stay informed of current conditions and their impacts, and to alert the public to hazards. Needless to say, many forecast offices across a wide area will be very busy over the next couple of days. Here in Tompkins County, Ithaca is forecast to receive 1.42", and right here in Freeville, we're expected to get a tad less than that. The forecast has gotten better over the last couple of days. For my dock's sake, let's hope it stays that way.

I want to give you a look at the process of forecasting an event like this. First, you have to know what's currently going on...forecasting starts with observations. In the US, forming the core of the observational network are the automated weather stations that are located at airports and other significant sites across the country. These stations measure temperature, dewpoint, winds, clouds, and precipitation, among other things, and they are reported every hour. There are other, usually local or regional, networks of automated weather stations as well. It's important to understand what's happening not just at the surface, but also through the depth of the atmosphere. Weather balloons are launched twice daily (morning and evening) from National Weather Service offices and other sites across the country. In preparation for Sandy this weekend, over 200 extra balloons were launched in the afternoon to gain additional data about the state of the atmosphere...a first! Of course, it's also important to have observations of precipitation, and for this there is a network of cooperative observers who report 24-hour rainfall every morning. Much like for surface observations, there are numerous local, regional, and national rain gauge networks to measure precipitation at time steps from every 5 minutes to every 24 hours.
In addition to the measurements that are taken in situ (directly in the environment), there are two major means of remote sensing used by meteorologists. Radar detects precipitation and estimates rainfall totals. The national radar network is currently undergoing an upgrade that will improve rainfall estimates, improve detection of precipitation type (snow, sleet, hail, graupel, rain, etc.), and have other benefits to forecasters and researchers. Radar can also estimate the direction of the wind field...this is what allows forecasters to find "Doppler-indicated" tornadoes. In addition to radar, satellites provide information about clouds, precipitation, moisture, and even surface temperature. For a storm like Sandy that has spent much of its life out to sea, satellite data is invaluable.
Once observations have been collected, they're fed into computer models that use the fundamental equations of the atmosphere to forecast future conditions. There are several models, and each model is run several times with small changes to the observations and with slightly different ways of estimating atmospheric processes to provide insight into the different ways that the atmosphere might evolve. The more similar the different model runs are, the more confident forecasters can be in what is likely to happen. Early in the process of forecasting Sandy, the models disagreed on where she would go. Most turned her westward and brought her onshore, but they disagreed as to where - anywhere from Virginia to Nova Scotia. A couple of models took her out to sea and kept her away from the US mainland. The following few figures show a series of predictions of the models' projected path for Sandy from late last week. You can see that as time went on, the models tended to agree on a US landfall, and they began to narrow the location down. Sorry for the blurry first figure!

Of course, forecasting is not left entirely up to the models. Human forecasters look at the model output and the current observations. Using their own knowledge of the models' tendencies, the trends from the current observations, and their knowledge of past storms, the forecasters make predictions about the most likely path for Sandy and the weather that she will bring. The National Hurricane Center is charged with forecasting hurricanes, and they produce graphics like the ones below. The dots indicate the most likely position of the storm's center, and the hatched area around it shows uncertainty in this path...the storm center is expected to stay within this cone. For a gigantic storm like Sandy, though, the storm's effects are felt well outside the cone. Take a look at the series of track forecasts below to see how the forecast has evolved over the last few days.
Of course, forecasting the path of the storm's center is only a small part of gauging the storm's
impact. The Hydrometeological Prediction Center makes forecasts of rainfall totals across the nation every day, and a storm like Sandy keeps the forecasters especially busy. Below is a series of maps showing HPC's long-term (5-day) forecasts for total rainfall. You can see how the rainfall forecast changed as predictions of Sandy's strength and path changed. Here in central New York, we're looking at 1-3" of rain over the next couple of days, though more than that is possible in local areas, especially on higher ground.


Here's tonight's rainfall forecast for the storm, issued by the local Weather Service office, located in Binghamton, NY. These offices are staffed 24/7, and they'll certainly have extra help around for the duration of the storm. The local offices are in charge of issuing watches and warnings (such as the Flood Watch and High Wind Watch that we're currently under) for their forecast areas. They also coordinate with local emergency managers, storm spotters, cooperative observers, broadcasters, and the public to stay informed of current conditions and their impacts, and to alert the public to hazards. Needless to say, many forecast offices across a wide area will be very busy over the next couple of days. Here in Tompkins County, Ithaca is forecast to receive 1.42", and right here in Freeville, we're expected to get a tad less than that. The forecast has gotten better over the last couple of days. For my dock's sake, let's hope it stays that way.
Subscribe to:
Posts (Atom)